San Francisco’s coastal waters have risen 8 inches over the last century. While predictions for rising levels for the rest of this century vary, scientists predict that by 2054, water will have risen anywhere from 11 to 20 inches.
According to the Pacific Institute, a global water think tank that actively attempts to influence the global development of sustainable water policies, both of San Francisco’s coastal communities are at risk. In their 2009 report, The Impacts of Sea Level Rise on San Francisco Bay, Pacific Institute assessed the vulnerabilities of the California coasts to sea-level rise, by studying 1,000 miles of shoreline. Their report cautions that while structures for coastal protection are adequate now, they won’t withstand future water levels.
“Rising carbon dioxide in the atmosphere heats the ocean and causes land ice to melt, which causes flooding,” said Matthew Heberger, the primary researcher of the Pac Institute study. “It also bears on water availability, wildfires, ecosystems, range and extent of different species, and acidification of the ocean. The CO2 increase causes effects on invertebrates, mollusks, crabs.”
All expect to see more severe and widespread floods in city areas along both coasts, like Mission Bay, Dogpatch, and Soma. Worse fates await neighboring counties, especially San Mateo and Marin. With the expected 1.4 m rise in sea levels, Pac Institute claims that over $100 billion in infrastructure and nearly 500,000 people are currently at risk of being adversely affected by coastal flooding.
Projected Impacts of Coastal Inundation
Assuming a yearly 1 percent chance of catastrophic flooding, 140,000 people (2 percent of the Bay Area’s population) live in localities subject to inundation. A sea-level increase of 1 meter (39.37 inches) between 2000 and 2083 puts 220,000 people at risk. A 1.4-meter (55.12-inch) increase by 2100 endangers 270,000.
Under existing conditions, some 80,000 residents of San Mateo County are at risk. Next are Marin, 25,000; and Santa Clara, 12,000. The San Francisco estimate is just 190.
A sea-level rise of half a meter by 2054 raises San Francisco’s endangered population to 600; a meter rise by 2083, to 1,600 residents; a 1.4 meter rise by 2100, to 3,800.
Workers at risk in the City number 1,800. A half-meter rise increases the total to 3,500; a meter rise, to 12,000; a 1.4 meter rise, to 41,000.
Outcomes can be better or worse, depending on governmental measures to protect the unsafe areas.
The effects of this water rise will damage homes, schools, hospitals, transportation, utility systems, emergency facilities, hazardous material sites, ports, and wetlands. A meter rise would threaten $49 billion in current Bay Area property.
Capital planning for S.F. threat
Climate change elevates seas globally at an accelerating rate and, according to Pac Institute, “poses a pervasive and increasing threat along San Francisco’s shorelines.” Planners must adapt to those changes. That is the theme of Guidance for Incorporating Sea Level Rise Into Capital Planning, a report prepared by the City’s 13-member Sea Level Rise Committee, headed by David Behar, climate program director of the SF Public Utilities Commission.
It urges planners to develop strategies against rising sea levels, storm surges and wave run-ups and tells how to assess vulnerability and risks of city assets. The report was issued for the SF Capital Planning Committee in September 2014, and is currently being revised to clarify some concepts, Behar said.
According to the Guidance report, sea elevation will permanently inundate low areas, erode shorelines, damage protections, raise tides up to three feet during El Niño winters, and overwhelm the San Francisco sewer system. The areas reclaimed from the Bay by landfill, notably Mission Bay and Treasure Island, are at the greatest risk.
Future flooding damage has the potential to close the airport, BART, Muni, and the Port; wreck buildings, roads, and bridges; cause prolonged power outages; release toxic materials; and erode natural shores, disturbing wetlands and habitats.
For their report, the Sea Level Rise Committee decided upon the sea-level rise estimates made by the National Research Council in 2012. California adopted these figures in 2013, to guide State planners. The projections are as follows:
Year Projection Ranges
2030 6 + 2 in. 2 to 12 in.
2050 11 + 4 in. 5 to 24 in.
2100 36 + 10 in. 17 to 66 in.
(These were calculated based on assumed moderate CO2 emissions and the resulting extrapolations of the accelerating patterns of melting ice. Figures, in inches, relate to 2000; + indicates plus or minus; “Ranges” are possible but unlikely extremes.)
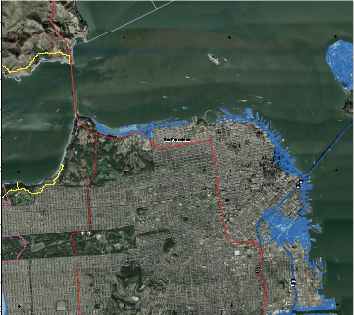
Visualizing Coastal Inundation and Sea Level Rise
There are a variety of online tools, provided by local water watchdog organizations, that can assist local stakeholders in learning more about the risks associated with coastal inundation and sea level rise. On the NOAA’s website, one can see a range of sea level rise scenarios, by using their interactive The Sea Level Rise and Coastal Flooding Impacts Viewer map.
Also available are the collaborative user-driven maps created by Our Coast, Our Future. These mapping tools can help users understand and anticipate land vulnerabilities for specific weather patterns. If you’re interested in gaining a deeper understanding of the statistics of who will be affected, and when, head over to The Climate Central – Surging Seas website. Their interactive mapping tools include factsheets, data downloads, neighborhood scales, and area timelines of risk. The ART Portfolio (Adapting to Rising Tides’) website offers a comprehensive set of online resources, and planning guides, to aid local stakeholders in addressing the challenges of sea level rise.
