The Department of Public Health (DPH) has released the latest High Injury Network (HIN) map, using 2024 data to identify San Francisco’s deadliest streets.
The good news is that Potrero Hill residents have less to worry about than inhabitants of other neighborhoods. The bad news is that some streets still warrant concern.
The new HIN map is the fourth produced since 2015, the year after the unveiling of Vision Zero, a data-driven approach to safety that had a perhaps unrealistic goal to completely eliminate traffic-related deaths. Based on the HIN map San Francisco Municipal Transportation Agency (SFMTA) identified where safety improvements were most needed, evaluating 28 projects to install road diets, high-visibility crosswalks, traffic-calming speed humps, and protected bike lanes.
According to the Mayor’s Office, these targeted physical modifications lowered total collisions by 16 percent, cut bicycle crashes by 25 percent, reduced pedestrian smashes by 35 percent, and decreased dangerous vehicle-to-pedestrian near-misses by 32 percent.
To build the HIN, DPH first identifies crashes in which someone was killed or severely injured, termed a “KSI,” based on data collected from the San Francisco Police Department (SFPD), Trauma Registry at Zuckerberg San Francisco General Hospital (ZSFG), California State Vital Records, and San Francisco Emergency Medical Services (EMS) ambulance records. To be HIN mapped, a street must have more than 10 KSIs per mile during the roughly two-year period in which information is collected.
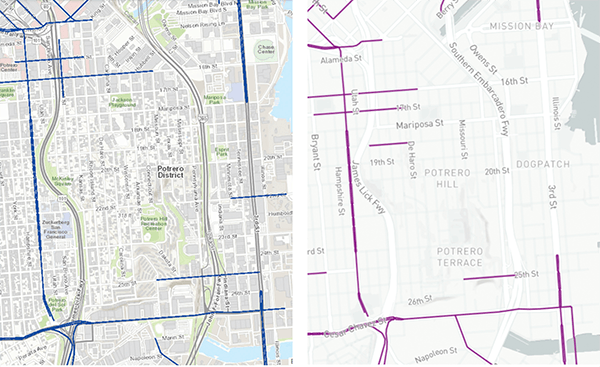
A comparison between the 2022 Potrero Hill map (above, left) and the newest version (above, right) shows few changes, with Potrero Avenue and Cesar Chavez the area’s most dangerous streets.
Since 2014, 364 crashes involving fatalities have happened City-wide. Only eight occurred in Potrero Hill, seven of which were on HIN streets. San Francisco recorded 25 traffic fatalities in 2025; seven traffic deaths have been logged so far in 2026. The last deadly crash in Potrero Hill occurred on November 23, 2024.
Last December, Mayor Daniel Lurie signed the Street Safety Initiative, an executive directive he called “the next phase of San Francisco’s roadway safety strategy.”
“We have learned a lot over the past ten years of Vision Zero,” Lurie said in a statement accompanying the announcement. “Now is the time to update our approach to this work.”
The effort is divided into three “actions:” 100 Day, Six Month, and One Year and Beyond. The HIN is part of the first phase and will be used, as it was with Vision Zero, to identify locations for “Quick Build Projects;” adjustable and reversible traffic safety improvements that SFMTA crews can install within months. They often incorporate proven safety tools, such as physical barriers and clearing sightlines at intersections, a technique known as daylighting. They’re supposed to be evaluated after being implemented to inform future projects.
When daylighting was implemented at 80 intersections in the Tenderloin during Vision Zero’s first year, collisions dropped by 14 percent the following year.
HIN is also used to determine where to deploy monthly High Visibility Enforcement (HVE), a strategy that uses noticeable, coordinated enforcement to deter dangerous behaviors, and in what locations to install electronic enforcement tools, including speed and red-light cameras.
According to SFMTA, the City’s 33 speed cameras have resulted in a nearly 80 percent drop in drivers traveling 10 miles per hour or more above the posted limit at camera locations. The only speed camera in Potrero Hill is on Cesar Chavez Street from Indiana Street to Tennessee Street, where the maximum is 25 mph.
The 13 red light cameras that issue citations have resulted in a 66 percent decline in injury collisions due to red-light running between 1997 and 2022. The City plans to install six more later this summer, none in Potrero Hill.
HIN was originally created in 2010, with a California Office of Traffic Safety grant to pay for the first phase of WalkFirst, a program to improve pedestrian circulation. The effort included maps of Key Walking Streets and Pedestrian High Injury Corridors. WalkFirst’s second phase started in 2013 and relied on the Pedestrian HIN to identify where capital improvements were most needed. The work continued under the Vision Zero banner, which expanded HIN data beyond walking to address all traffic-related fatalities.
The next HIN map will likely be issued in 2027, based on 2026 data.
